CURVE SKETCHING
 |
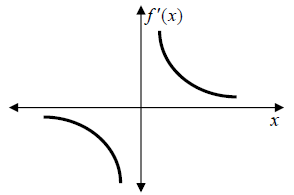
 is undefined at is undefined at
 is decreasing when is decreasing when
  is decreasing when is decreasing when

|
CRITICAL/EXTREME POINT:
Another important concept needed in curve sketching is that of a critical point.
If 
is in the domain of  and either
 or
or  is not defined, then
  is called a
critical value of the function , and
, and
 is called a
critical point. A critical point
may be a maximum point, minimum point, or
neither.
A relative (or local) maximum point is a critical point where the function
changes from
increasing to decreasing.
A relative (or local) minimum point is a critical point where the function
changes from
decreasing to increasing.
The critical point is neither a maximum nor a minimum if the function does not
change
from increasing to decreasing (or vice versa) at the critical point.
 |
||
 is defined and is defined and  so so
critical point. •  is increasing before is increasing before  and decreasing after and decreasing after  so so
|
•  is defined and is defined and
undefined so (c,f(c)) is a critical point. •  is decreasing before is decreasing before  and increasing after and increasing after  so so
relative minimum |
•
 is defined and is defined and so (0,0) is a so (0,0) is a critical point. •  is increasing before is increasing before neither a max nor a min. |
To locate the critical points on the graph:
1. Take the first derivative of the function and determine the values  where
where
![]() or
or
![]() is undefined.
is undefined.
2. If c is in the domain of , then
![]() is a critical point.
is a critical point.
For example:

Earlier we found that  , when
 and
and
![]() , and
, and
![]() is defined
is defined
everywhere. Since  is defined for both
 and
and
![]() , we have found two
critical
, we have found two
critical
values.
Substituting these values into our original function, we find that

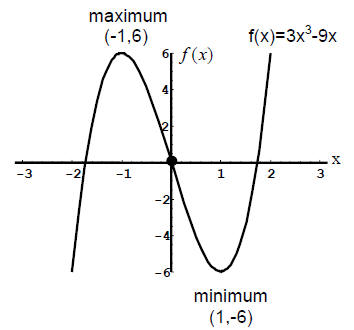
Thus, we have found critical points at (1,-6) and (-1,6).
You can determine whether these points are local maximum points, local minimum
points, or neither, using either the first derivative test or the second
derivative test (the
second derivative test will be explained in the next
section).
FIRST DERIVATIVE TEST
1. Determine where the function is increasing or decreasing.
2. If the function is increasing before the critical value and decreasing after
the critical
value, then the critical point is a local maximum. If the function is decreasing
before
the critical value and increasing after, the point is a local minimum.
Otherwise, the
critical point is neither a maximum nor a minimum.
For example: Earlier we found critical points for
![]() at (1,-6) and
(-1,6). To
at (1,-6) and
(-1,6). To
determine whether these points are local maximums or minimums, use
the first
derivative test.
First, determine where ![]() is increasing and decreasing.
is increasing and decreasing.
The critical values found above were
![]() and
and
![]() .
.
From our previous example we found that is increasing on (-∞,1), decreasing
on
(-1,1), and increasing on (1,∞). Thus, we had the following number line:

At the critical value
![]() , the function changes
from increasing to decreasing.
, the function changes
from increasing to decreasing.
Therefore, (-1,6) is a local maximum.
At the critical value ![]() , the function changes from decreasing to increasing.
, the function changes from decreasing to increasing.
Therefore, (1,-6) is a local minimum.

CONCAVITY:
Concavity describes the general "cupping" of a function at a particular point or
interval.
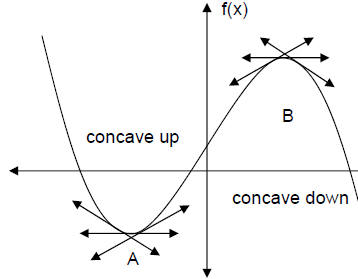
When the slope of the tangent to the curve is increasing over an
interval (![]() is
is
increasing - i.e.  ), the function is concave up. When the
slope of the tangent to
the curve is decreasing over an interval (![]() is decreasing, i.e.
is decreasing, i.e.  ), the function
is concave down.
| Slope of tangent lines is decreasing ((  ) on the ) on theinterval |
||
 |
||
| Slope of tangent lines is increasing (  ) on the interval ) on the interval
|
Notice that the point A is a critical point (since the
slope of the tangent line is 0 at A) and
 is concave up at A. We can see that
A is a local minimum. Also, the point B is a
critical point (since the slope of
the tangent line is 0 at B) and is concave down at B.
We can see that B is a
local maximum.
Concavity can help us determine if a critical point is a local maximum or a
minimum.
The following is the second method for determining whether a critical
point is a local
maximum or a minimum.
SECOND DERIVATIVE TEST
If ![]() is a critical point, then:
is a critical point, then:
1. If  , the function is concave down at that
point and thus
 ![]() is
a local
is
a local
maximum point.
2. If  , the function is concave up at that
point and thus
 ![]() is a
local
is a
local
minimum point.
3 If  , then the second derivative test fails to determine if the point is a
local maximum
or a minimum. In this case, the first derivative test mentioned earlier should
be used.
Example: Let's go back to the function

Our critical points were (-1,6) and (1,-6).
Using the second derivative test we obtain the following:
 Since
Since
 , the function is concave down at (-1,6),
thus (-1,6)
 is a local maximum.
 Since
Since  , the function is concave up at (1,-6), thus
(1,-6) is
 a local minimum.
We see that we get the same results using the Second Derivative Test as we do
using
the First Derivative Test.
INFLECTION POINTS:
An inflection point is a point on a graph (in the domain of ) where concavity
changes from concave up to concave down, or vice-versa. Concavity can change at
values where  or
or
 is undefined.
To find inflection points:
1. Determine where the function is concave up and where it
is concave down:
a) Determine the value(s) of x where  or
or
 is undefined.
b) Order the values found above in increasing order and plot them on a number
line.
c) For every interval between two consecutive values, choose a test value in
that
interval.
d) Determine the value of at the test value.
e) If ![]() at the test value, then
at the test value, then
![]() is concave up on that interval.
If
is concave up on that interval.
If ![]() at
at
the test point, then is concave down on that interval.
2. If the function changes from concave up to concave down (or vice-versa) at 
and ![]() is defined, then
is defined, then
![]() is an inflection point.
is an inflection point.
Example: Earlier we found that the second derivative of
![]() was
was
 . Thus
![]() when
when
![]() , and
, and
![]() is defined everywhere.
is defined everywhere.
Plotting this on a number line we get:

For the interval (-∞,0), choose
![]() to be our test point:
to be our test point:

Since , ![]() ,
, is
concave down on the interval (-∞,0).
For the interval (0, ∞), choose
![]() to be our test point:
to be our test point:
![]()
Since ![]() ,
,  is
concave up on the interval (0, ∞).
Labeling our number line we get:

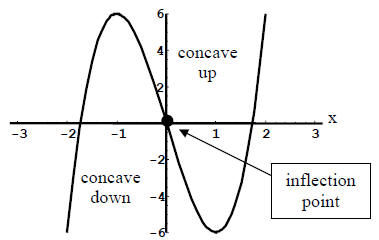
Since  changes from concave down to concave up at
![]() and
and  is defined at ,
![]() ,the point
,the point
 is an inflection point.


Remember that values where
![]() or
or
![]() is undefined
are only potential places
is undefined
are only potential places
where the graph can change concavity. It is possible,
however, that the function may
not change concavity at those values.
For example, consider  . Then
 and
and  , hence
![]()
when .![]() .
.
Plotting this on a number line we get:

For the interval (-∞,0), choose
![]() to be our test point:
to be our test point:

Since ,  ,
, is
concave up on the interval (-∞,0).
For the interval (0,∞), choose
![]() to be our test point:
to be our test point:

Since  ,
,  is
concave up on the interval (0, ∞).
Labeling our number line we get:

In this example
![]() is concave up when
is concave up when
![]() and concave
up when
and concave
up when ![]() .
.
Concavity did not change at
![]() , so the point (0,0) is not an inflection
point.
, so the point (0,0) is not an inflection
point.


